Product analytics platform dashboards you can tailor to your KPIs
Take Control of Your Data Visualization
May 29, 2024
Jump to section
We are thrilled to announce the release of Custom Dashboards, an exciting new feature that empowers you to create and personalize your dashboards for visualizing and filtering your custom events.
This feature addresses the growing need for more control and flexibility in the data visualization within Vexo, allowing you to tailor your dashboard to fit your needs and have a simpler way to understand complex data sets, through an intuitive and simple interface.
In this blog, we'll explore what Custom Dashboards are, and their various use cases across different teams, and provide a step-by-step guide on how to use them. We'll also discuss future improvements and explain why this feature is available exclusively for Enterprise users.
What is a Custom Dashboard?
Custom Dashboards were built to give you better visualization over your data, enabling you to create widgets to track your specific custom events. Bigger apps with more events will benefit significantly from this feature, simplifying and visually representing the complexity of their business model in the dashboard.
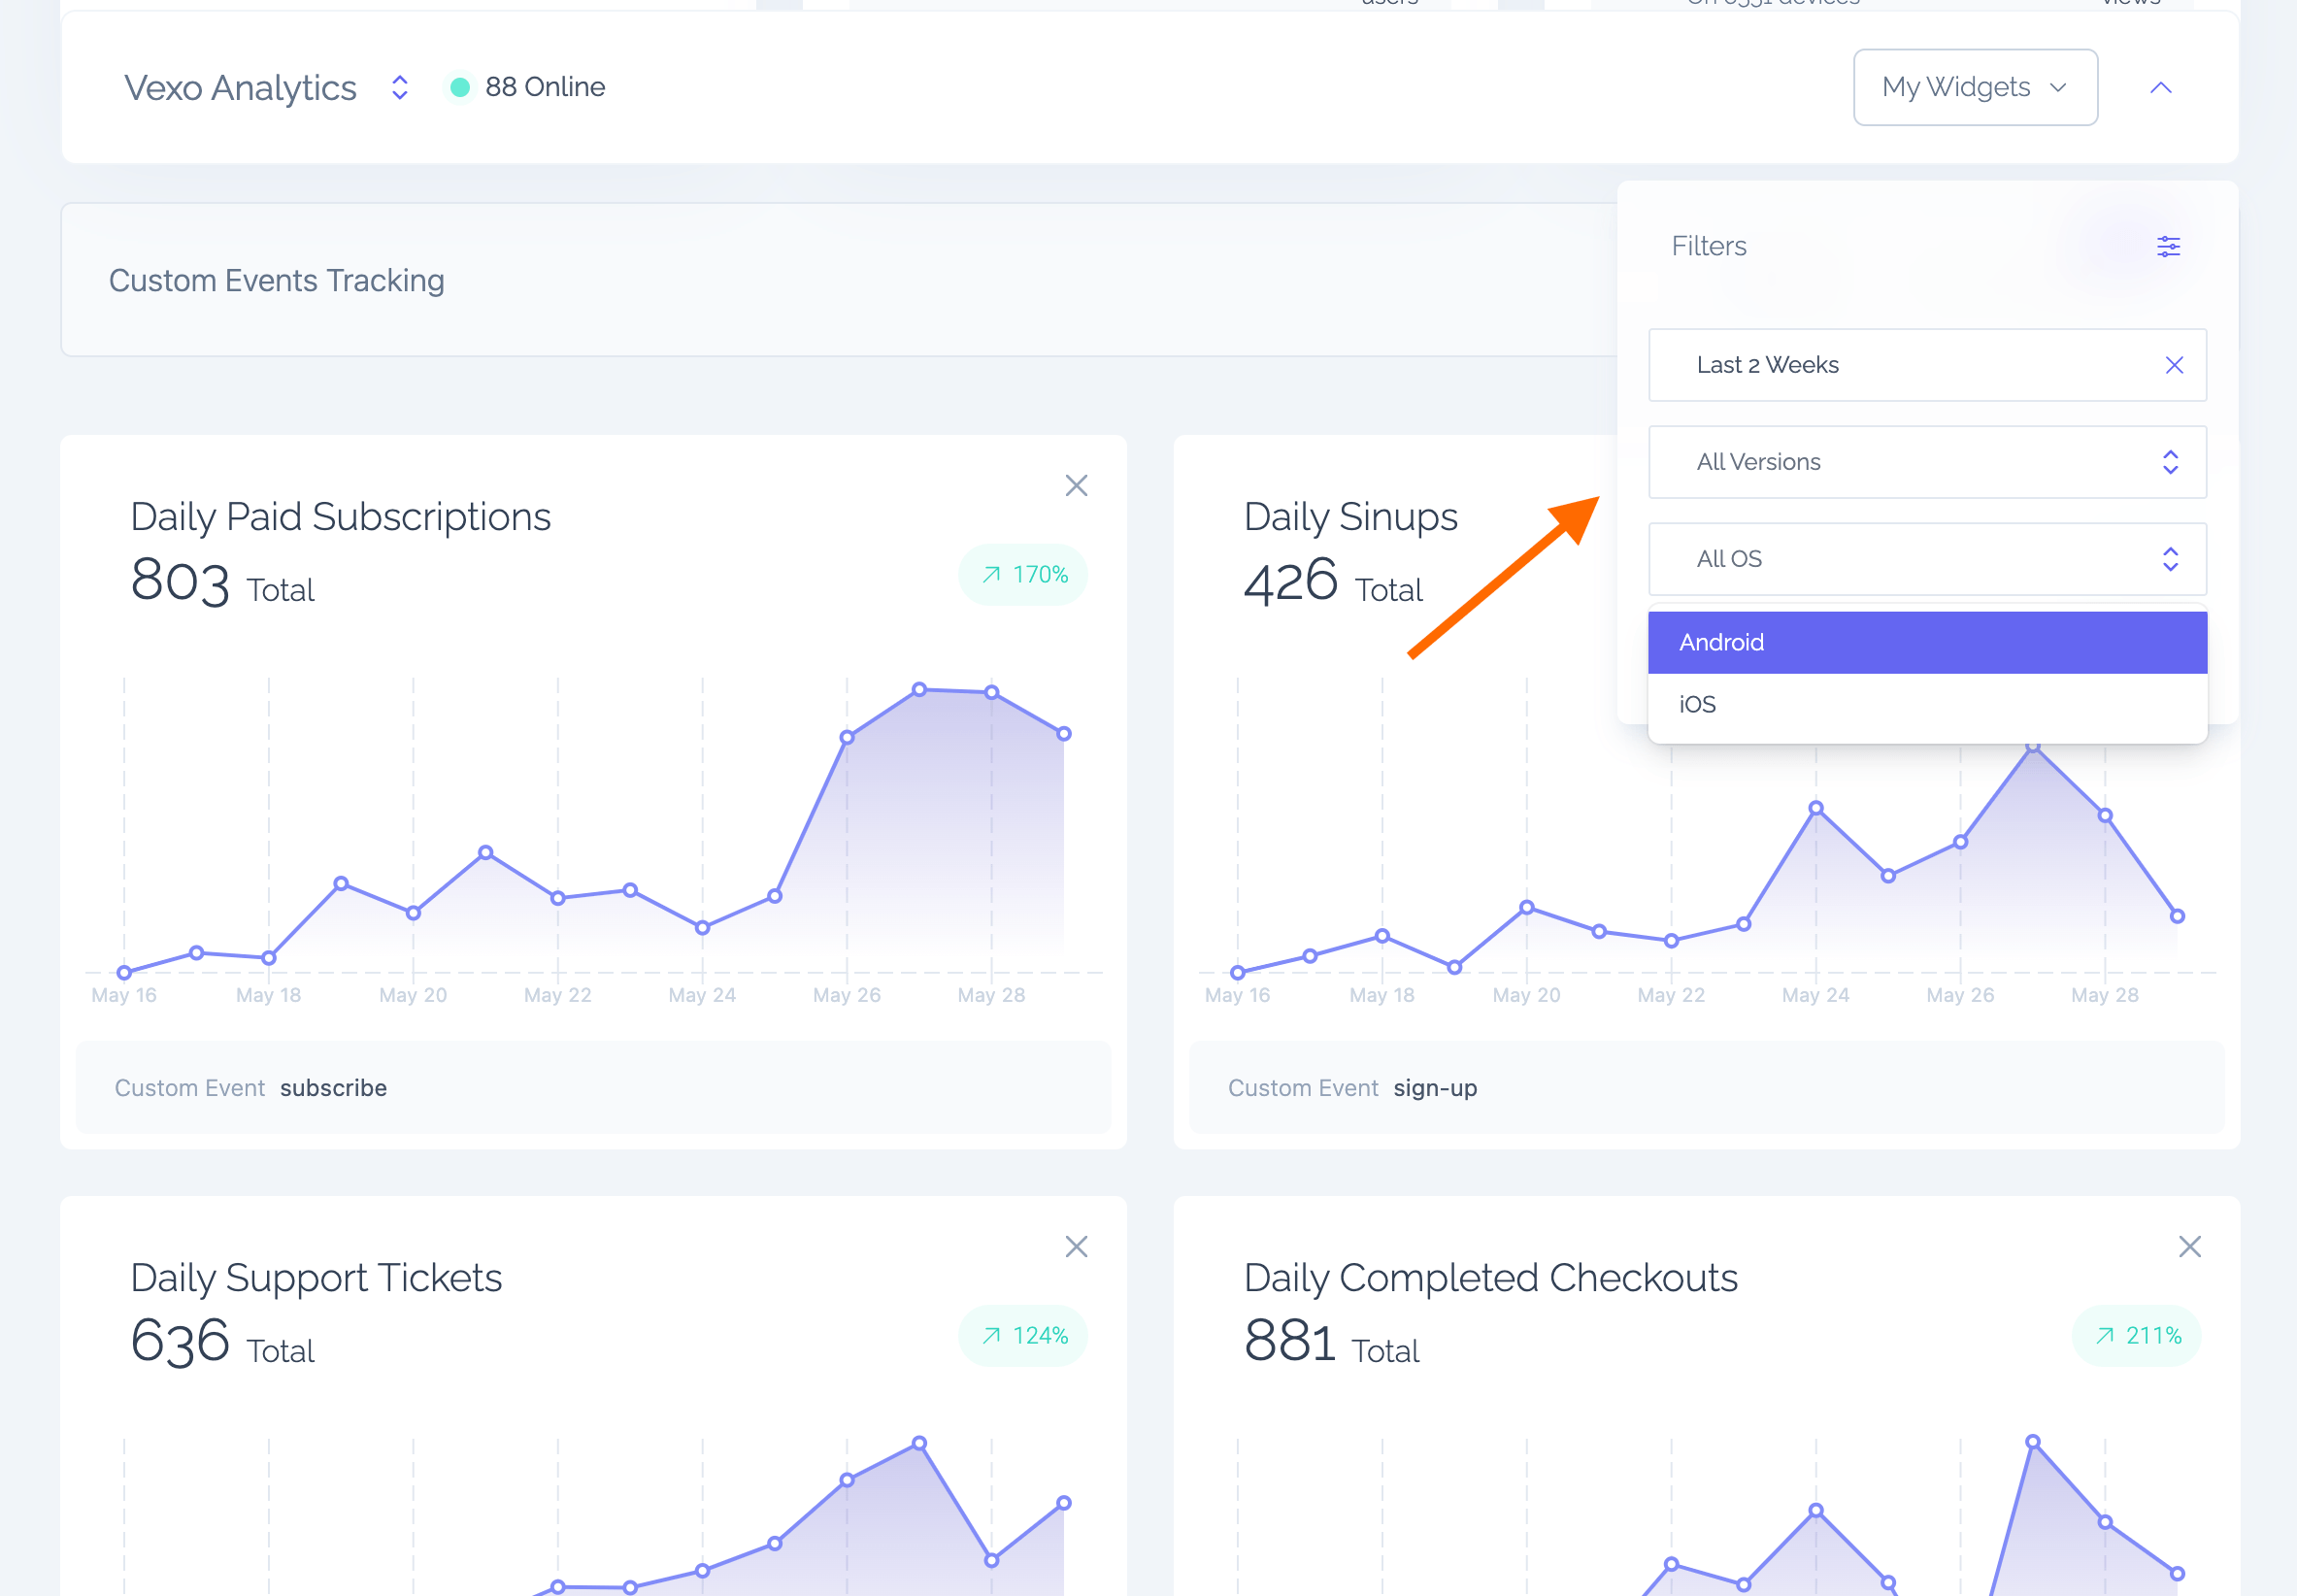
The interface is designed to be simple and intuitive, allowing you to query daily data and filter within a certain date range, operating system, app version and country.
Custom Dashboards display charts based on your data queries, helping you understand your users' activities and track your success metrics on a simple and clear way.
Use Cases for Custom Dashboards
Executive Teams
Get a high-level overview of your product performance, track KPIs, and make data-driven decisions.
Best Seller Product Tracking: A best-seller product needs to be tracked and studied. Monitor daily sales of a specific product and filter by country to see sales in different regions.
Engineering Teams
The flexibility of custom events enables developers to track any data point of interest, from memory usage to UI freezes. If it can be tagged and measured, it can be tracked. This capability facilitates comprehensive application performance monitoring, allowing developers to observe how their application performs over specific timeframes or among particular user subsets. Consequently, they can swiftly identify regressions or potential user pain points, enhancing the overall user experience.
Product Teams
Understand product performance and decide where to focus next.
Churn: Daily visualizations are essential for identifying behavioral anomalies. An unusual spike in any data point signals a change in user interaction with your application. Custom dashboards make detecting these anomalies straightforward. The next step is to determine the cause, where tools like heatmaps and session replay become invaluable. By combining the broad insights from custom dashboards with the detailed analysis provided by heatmaps and sessions, you can gain a deeper understanding of your users than ever before.
Marketing and Sales Departments
Measure campaign effectiveness, monitor new releases, and track sales.
New Product Marketing Campaign: After launching a new product, track how many people viewed the product and clicked 'Buy'. Create custom widgets to visualize these events and compare daily trends to identify any anomalies.
How to Configure Your Custom Dashboard
To add a widget to your custom dashboard, ensure you have at least one custom event configured.
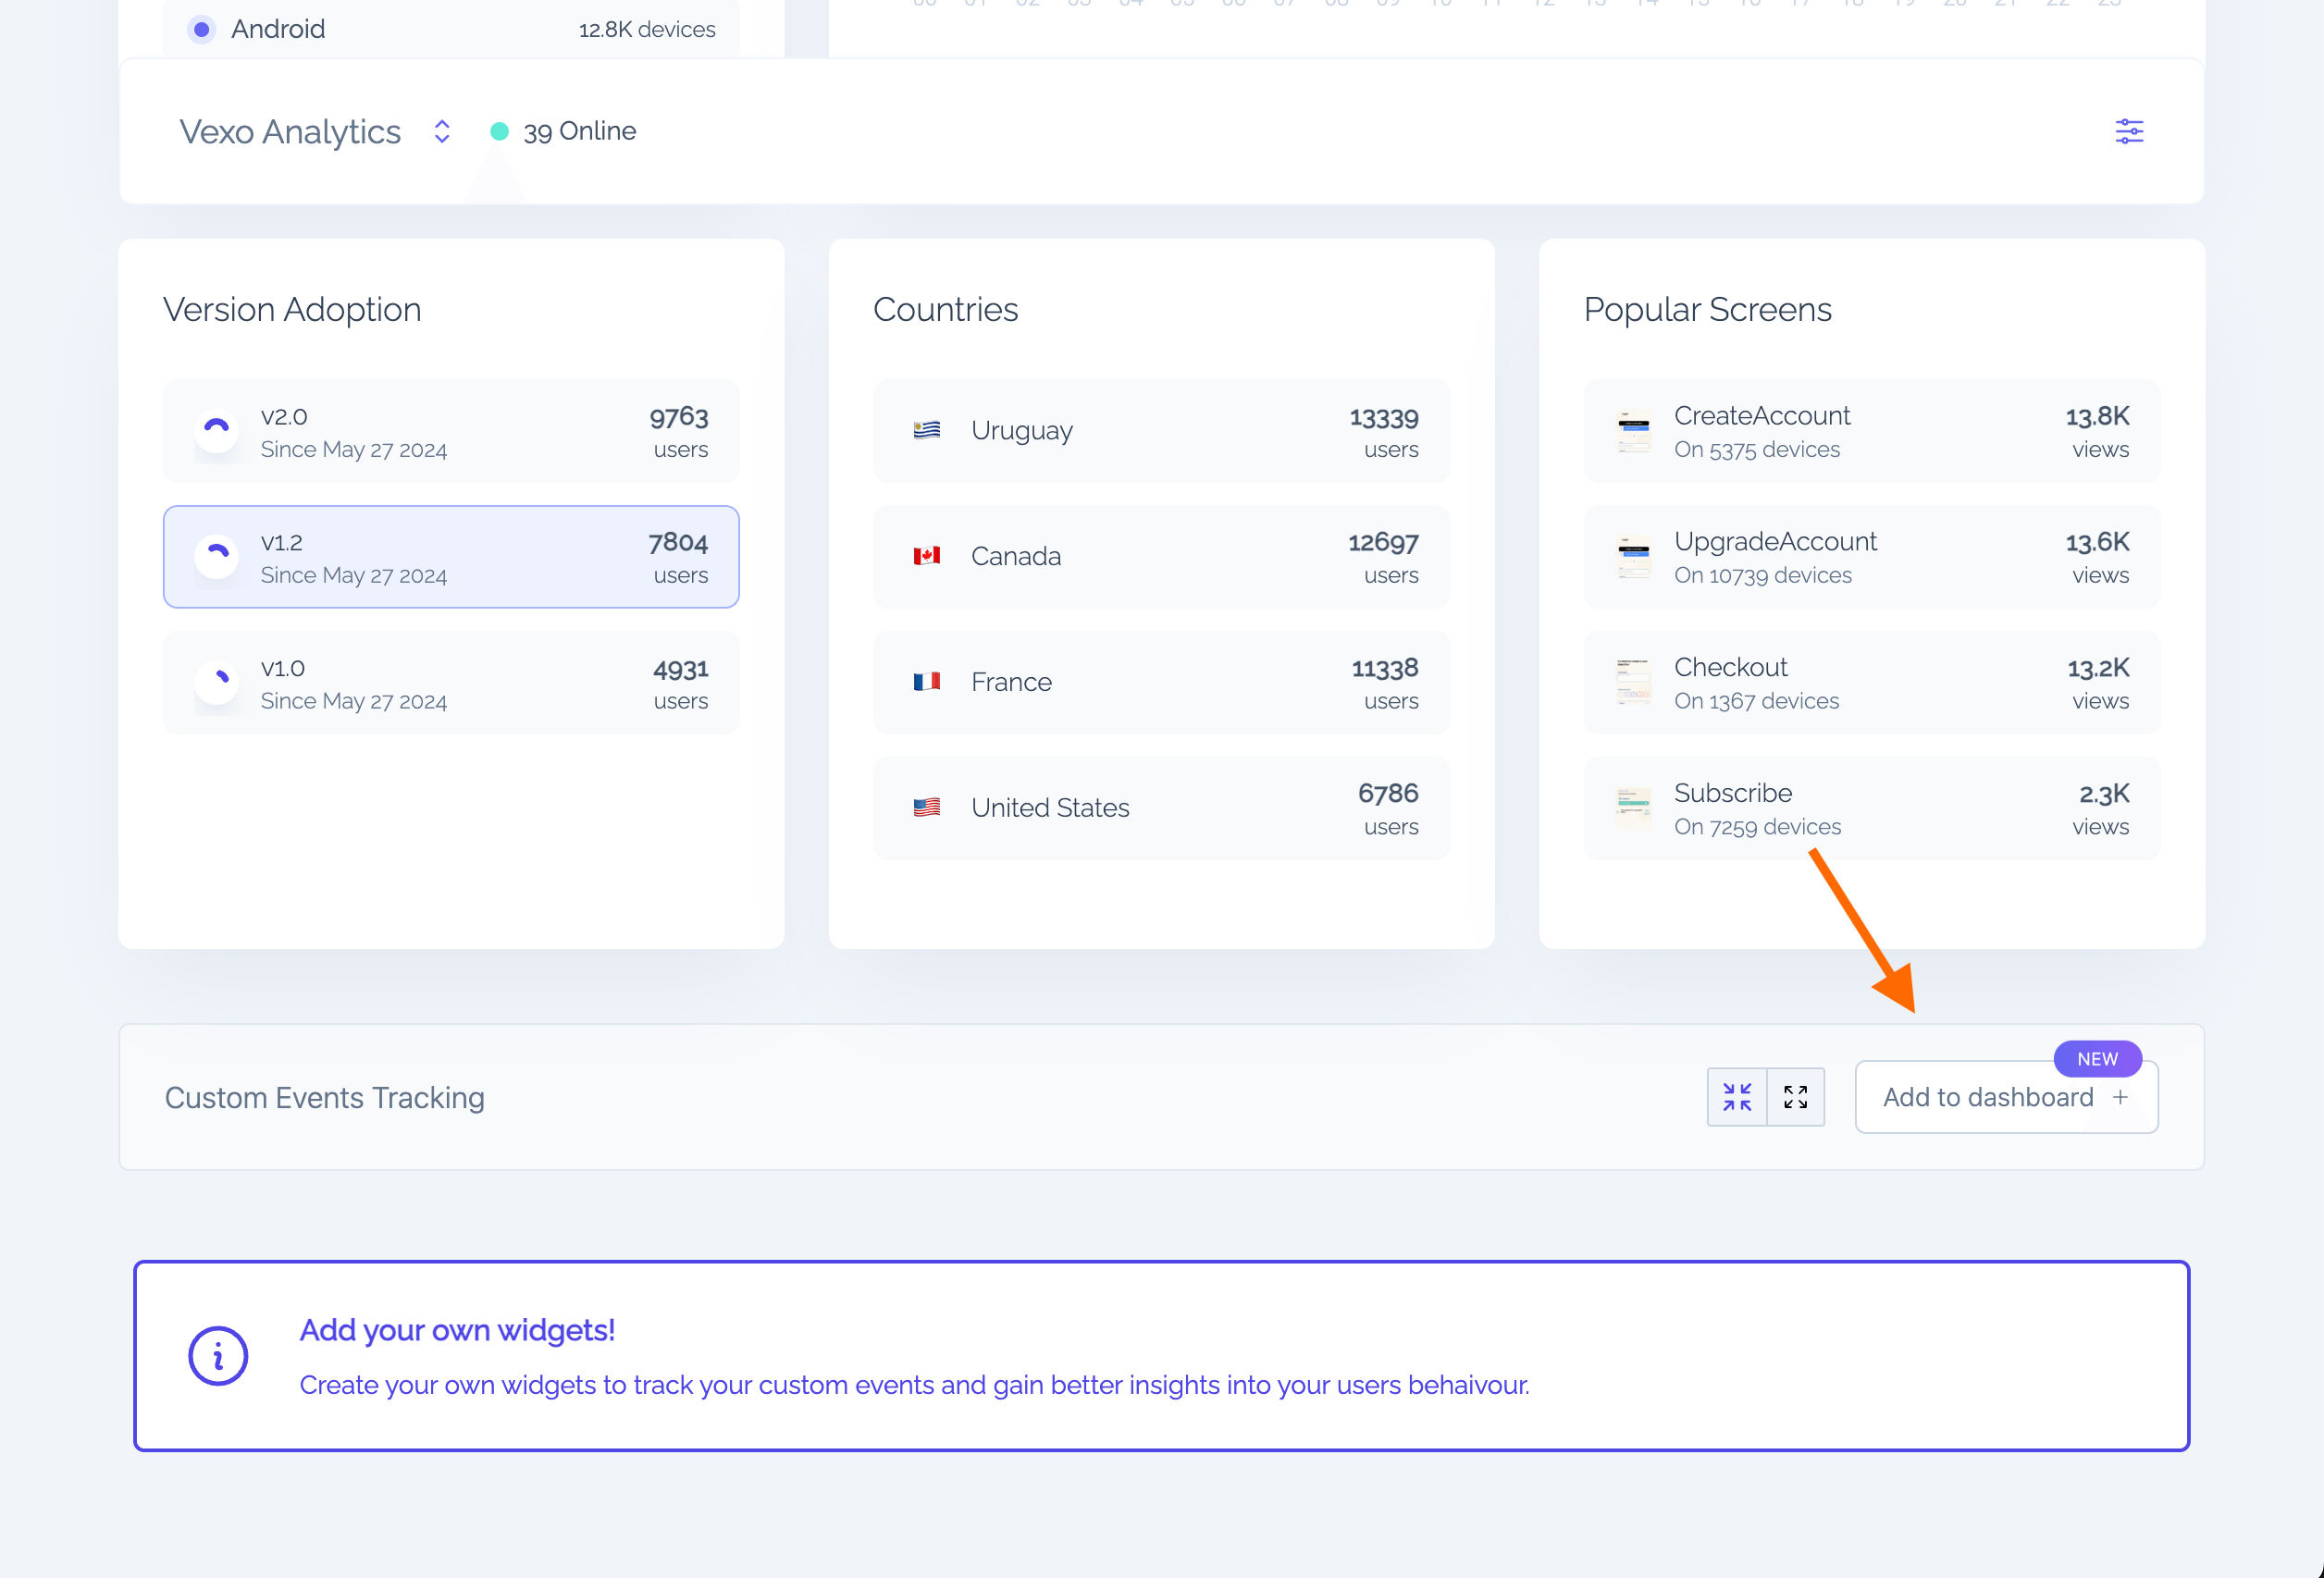
Navigate to the Custom Dashboards section at the bottom of your main dashboard.
1. Navigate to the Custom Dashboards section at the bottom of your main dashboard.
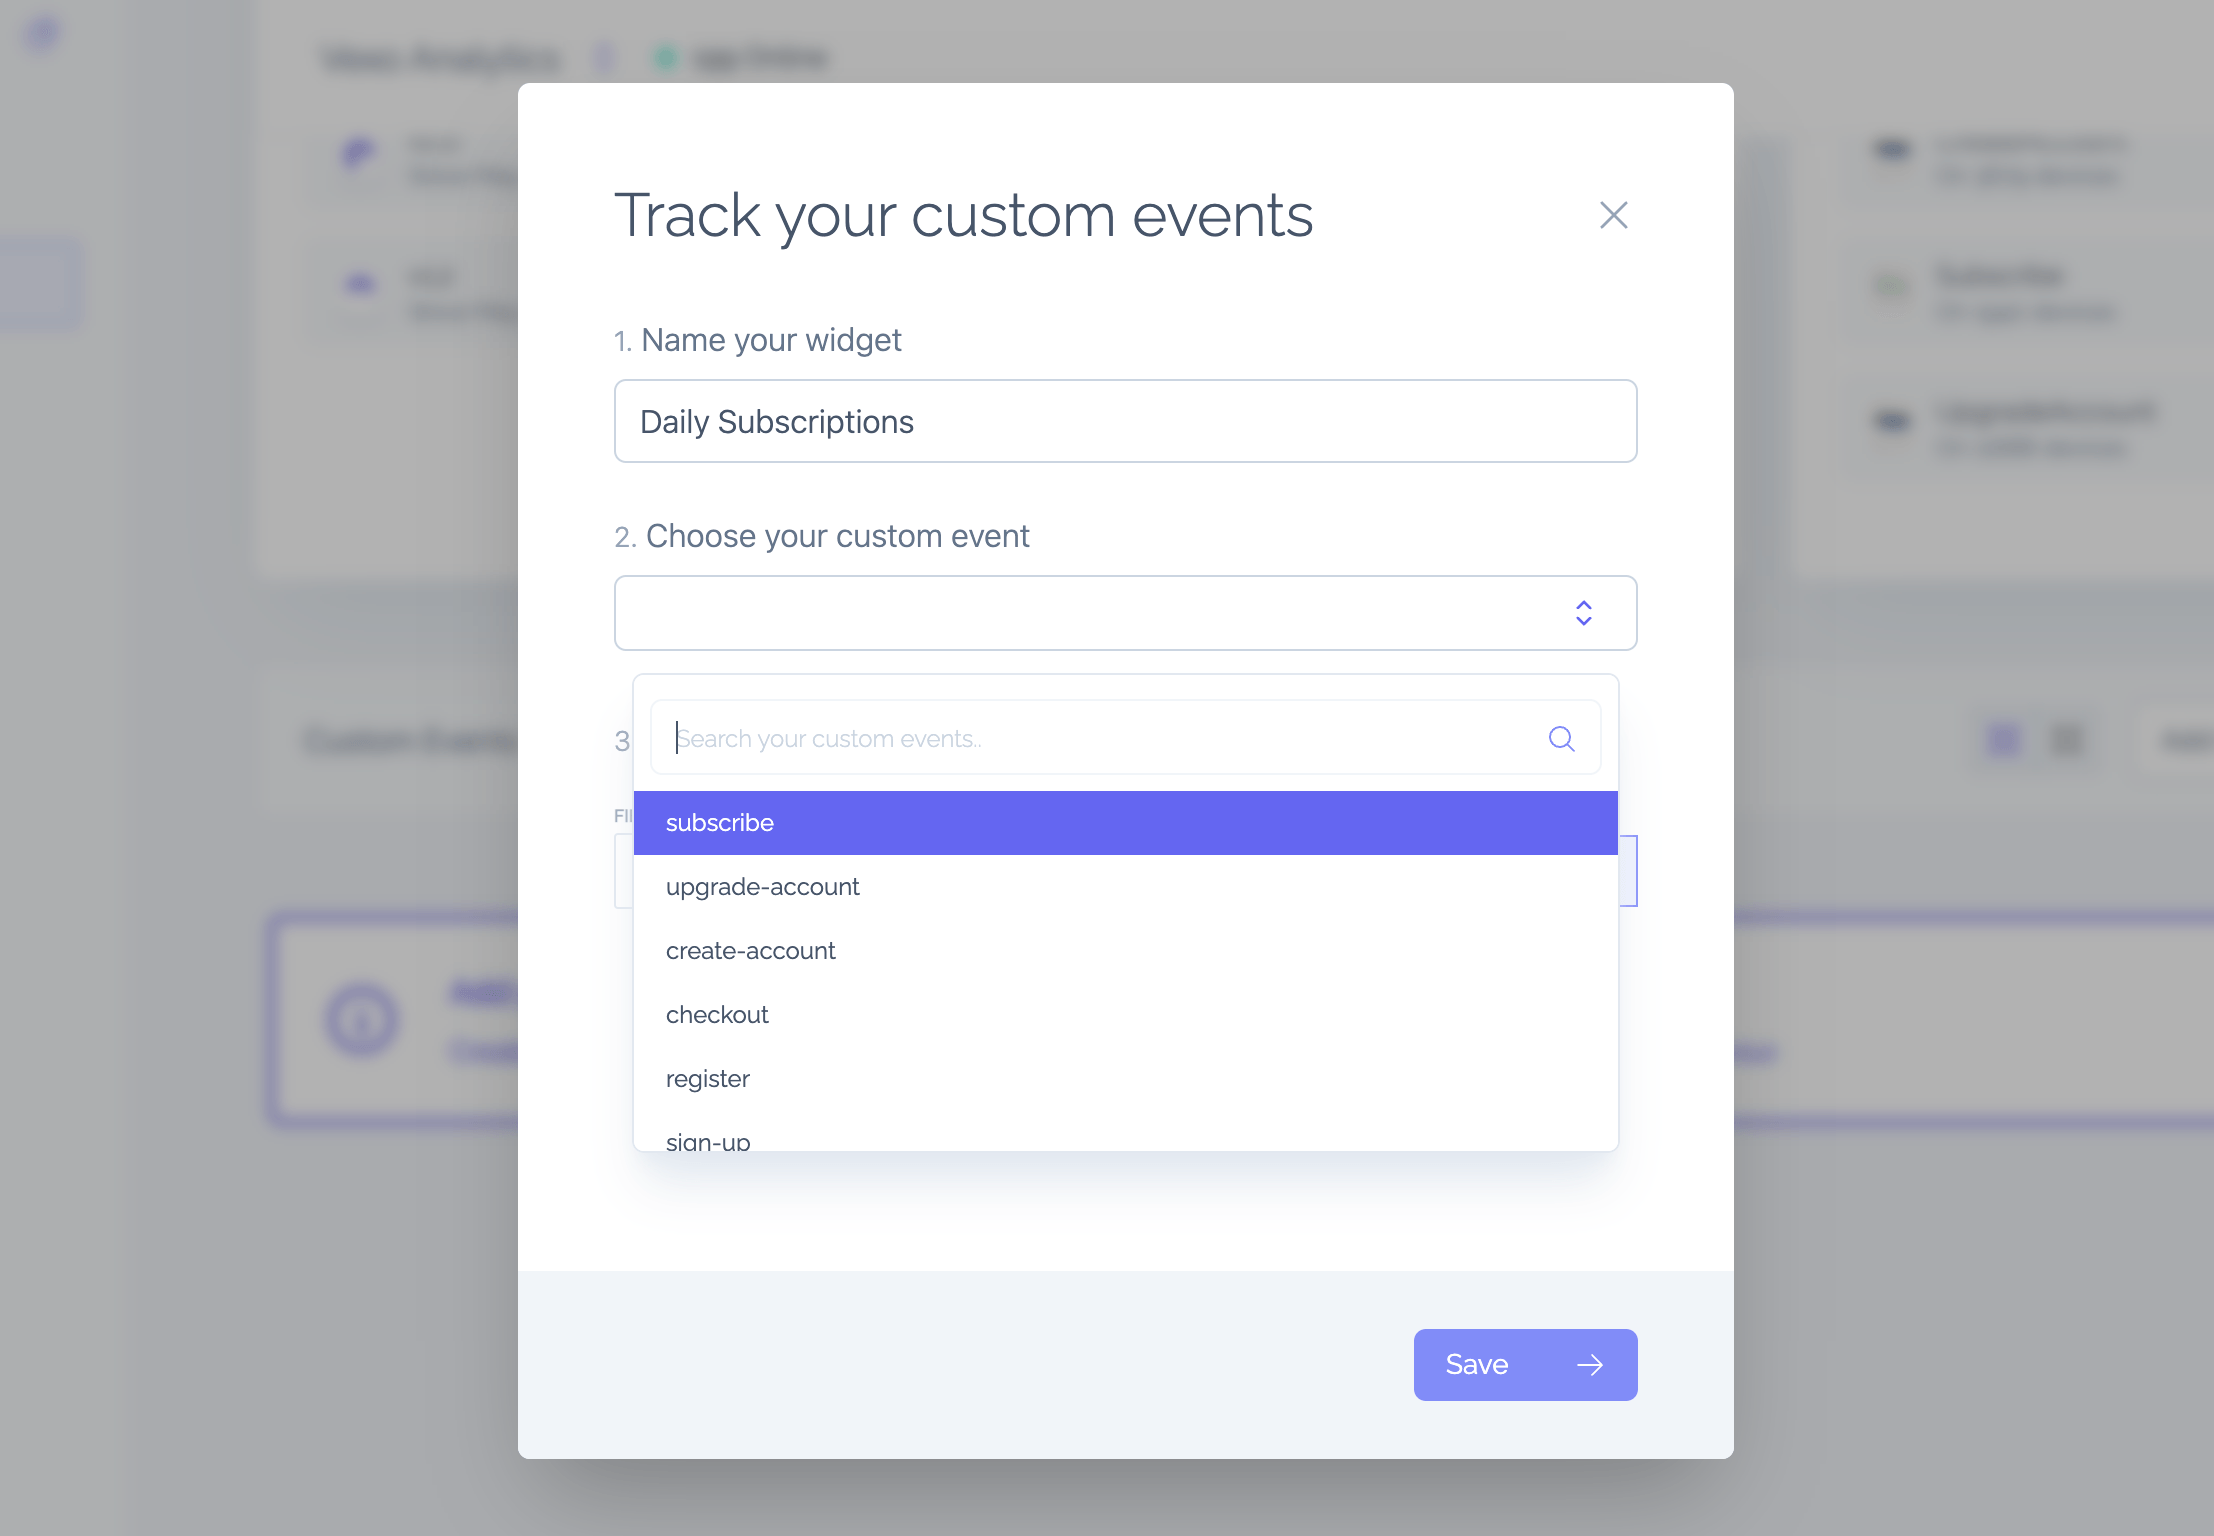
2. Name your widget. Choose your Custom Event. Add Filters (optional).
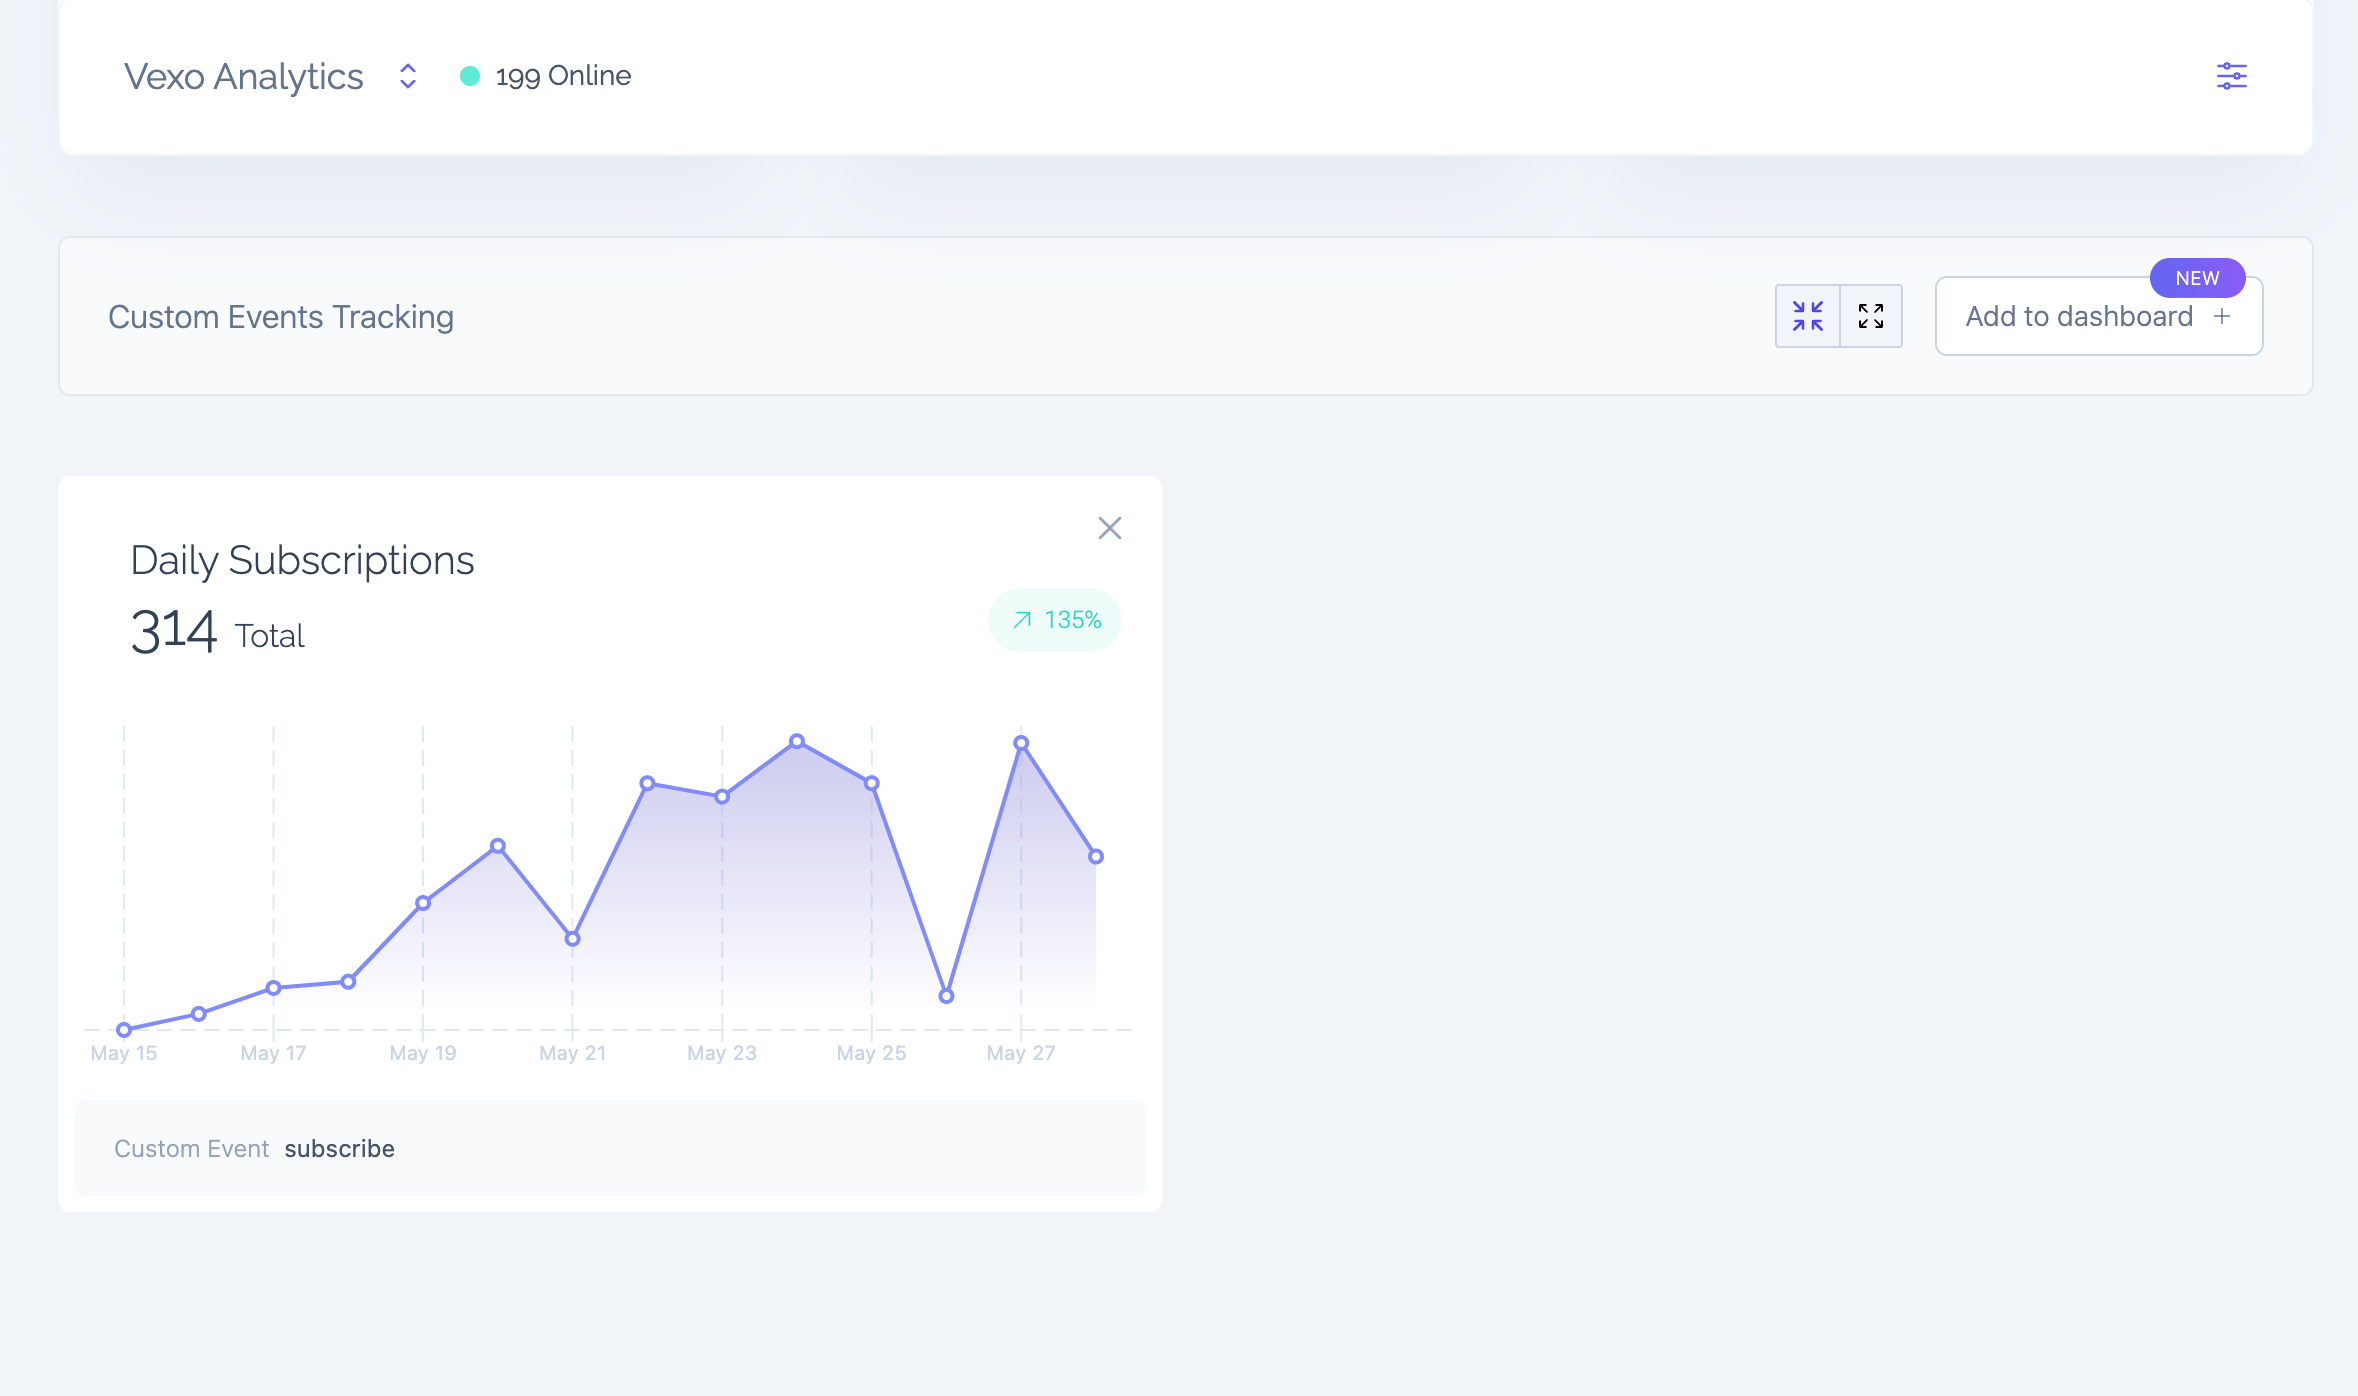
3. Visualize and enjoy the data.
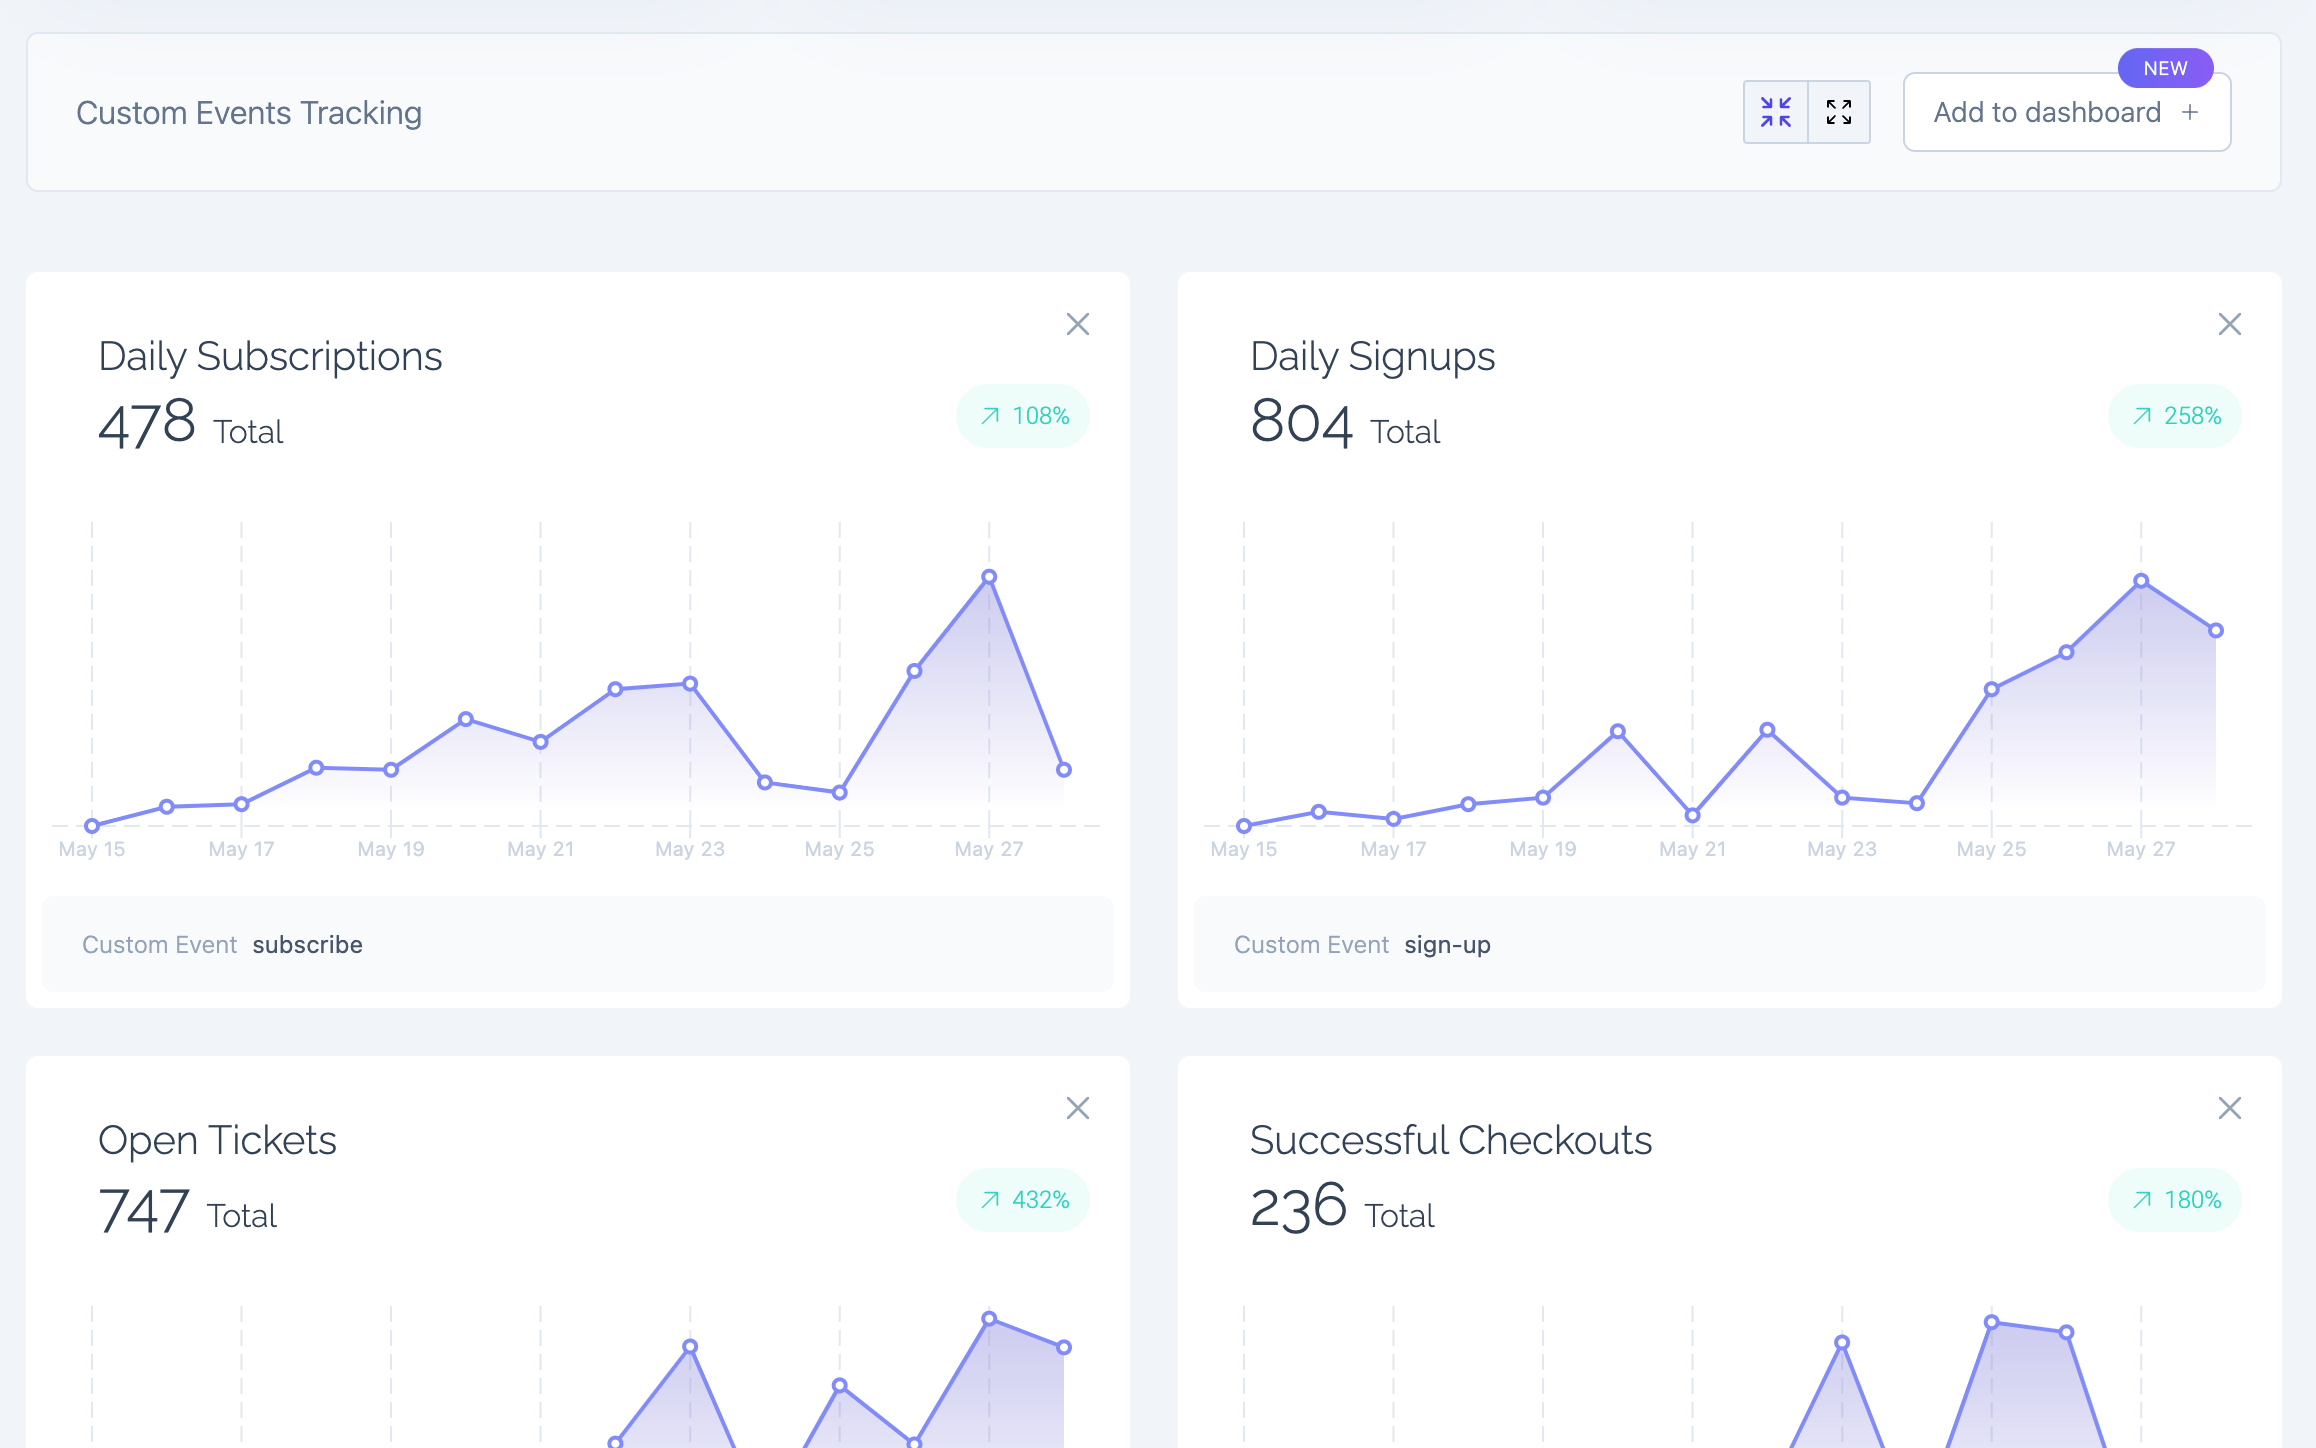
4. Add more Widgets.
5. Use the Global Filters to view charts and totals with different date ranges, app versions, operating systems, or countries.
Navigate to the Custom Dashboards section at the bottom of your main dashboard.
Future Improvements for Custom Dashboards
Currently, Custom Dashboards display charts with the daily data of the Custom Events which can be filtered within the Custom Event itself, but also with the Global Filters to filter by Date, App Version, Operating System and Country.
Soon you will be able to configure a widget to do more complex operations like aggregations, calculate the median or a specific value over time.
Why are Custom Dashboards Enterprise Only?
Custom Dashboards is an advanced and resource-intensive feature. Our infrastructure supports it and is ready to scale to billions of daily requests. However, to ensure sustainability, we are limiting this feature to users within the Enterprise Plan. Each request queries millions of data points to present individual insights, and every change made through the Global Filters requires re-querying these data points.
One last thought
We're always building new features, like this one, to help you and your team be more successful and use real data for improving your app and business. If you have specific features you'd like us to build, let us know at hello@vexo.co. We're listening!


